Statistik Dasar
| Pemilik Institusi | 157 total, 155 long only, 1 short only, 1 long/short - change of -3,80% MRQ |
| Alokasi Portofolio Rata-rata | 0.2257 % - change of -34,45% MRQ |
| Saham Institusi (Long) | 8.576.191 (ex 13D/G) - change of 0,45MM shares 3,88% MRQ |
| Nilai Institusi (Long) | $ 445.925 USD ($1000) |
Kepemilikan Institusi dan Pemegang Saham
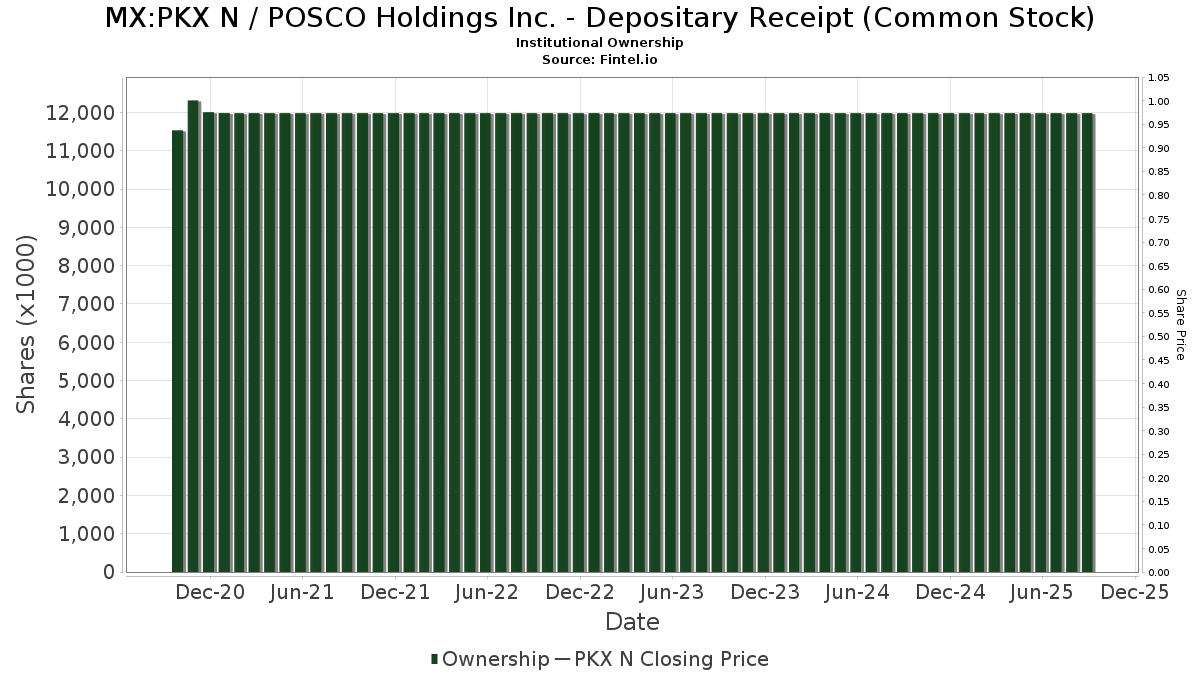
POSCO Holdings Inc. - Depositary Receipt (Common Stock) (MX:PKX N) punya 157 pemilik institusi dan pemegang saham yang telah mengajukan formulir 13D/G atau 13F ke Securities Exchange Commission (SEC). Institusi-institusi ini memiliki total 8,576,191 saham. Pemegang saham terbesar termasuk BlackRock, Inc., Dimensional Fund Advisors Lp, Morgan Stanley, State Street Corp, American Century Companies Inc, Northern Trust Corp, Vanguard Group Inc, Bnp Paribas Arbitrage, Sa, Connor, Clark & Lunn Investment Management Ltd., and Creative Planning .
POSCO Holdings Inc. - Depositary Receipt (Common Stock) (BMV:PKX N) struktur kepemilikan institusi menunjukkan posisi saat ini di perusahaan menurut institusi dan dana, serta perubahan terkini dalam ukuran posisi. Pemegang saham utama dapat mencakup investor individu, reksa dana, hedge funds, atau institusi. Jadwal 13D menunjukkan bahwa investor memegang lebih dari 5% saham perusahaan dan bermaksud untuk secara aktif melakukan perubahan dalam strategi bisnis. Jadwal 13G menunjukkan investasi pasif lebih dari 5%.
Skor Sentimen Dana
Skor Sentimen Dana (Ownership Accumulation Score) menemukan saham-saham yang paling banyak dibeli oleh dana. Hal ini merupakan hasil dari model kuantitatif multifaktor yang canggih yang mengidentifikasi perusahaan-perusahaan dengan tingkat akumulasi institusi tertinggi. Model penilaian menggunakan kombinasi total peningkatan pemilik yang diungkapkan, perubahan alokasi portofolio pada pemilik tersebut, dan metrik lainnya. Angka tersebut berkisar dari 0 hingga 100, dengan angka yang lebih tinggi menunjukkan tingkat akumulasi yang lebih tinggi terhadap rekan-rekannya, dan 50 adalah rata-ratanya.
Frekuensi Pembaruan: Harian
Lihat Penjelajah Kepemilikan, yang menyediakan daftar perusahaan dengan peringkat tertinggi.
AI+ Ask Fintel’s AI assistant about POSCO Holdings Inc. - Depositary Receipt (Common Stock).
Select a question to share a public post with an AI-crafted answer.
Thinking of good questions…
Pengajuan 13F dan NPORT
Detail pengajuan 13F gratis. Detail pengajuan NP memerlukan keanggotaan premium. Baris hijau menunjukkan posisi baru. Baris merah menunjukkan posisi yang sudah ditutup. Klik tautannya ikon untuk melihat riwayat transaksi lengkap.
Upgrade
untuk membuka data premium dan mengekspor ke Excel ![]() .
.
| Tanggal Berkas | Sumber | Investor | Jenis | Harga Rata-rata (Perkiraan) |
Saham | Δ Saham (%) |
Dilaporkan Nilai ($1000) |
Δ Nilai (%) |
Alokasi Portofolio (%) |
|
|---|---|---|---|---|---|---|---|---|---|---|
| 2026-02-13 | 13F | Cornerstone Financial Management LLC | 172 | 9 | ||||||
| 2026-02-17 | 13F | Summit Global Investments | 12.093 | 18,98 | 1 | |||||
| 2026-02-11 | 13F | Parallel Advisors, LLC | 7.802 | 60,44 | 415 | 73,64 | ||||
| 2026-02-14 | 13F | Rockefeller Capital Management L.P. | 5.112 | -4,59 | 272 | 3,42 | ||||
| 2025-11-13 | 13F | Hsbc Holdings Plc | 0 | -100,00 | 0 | |||||
| 2026-01-30 | 13F | Us Bancorp \de\ | 22.474 | 75,17 | 1.196 | 89,38 | ||||
| 2026-01-26 | 13F | Cwm, Llc | 2.946 | 17,56 | 0 | |||||
| 2026-01-14 | 13F | Jfs Wealth Advisors, Llc | 228 | 0,00 | 12 | 9,09 | ||||
| 2026-02-17 | 13F | Two Sigma Investments, Lp | 21.792 | 0,00 | 1.160 | 8,12 | ||||
| 2026-02-05 | 13F | Bank Julius Baer & Co. Ltd, Zurich | 950 | 0,00 | 51 | 8,70 | ||||
| 2026-02-13 | 13F | Rhumbline Advisers | 34.319 | -6,25 | 1.826 | 1,39 | ||||
| 2026-02-17 | 13F | Graham Capital Management, L.P. | 6.312 | -19,61 | 336 | -13,21 | ||||
| 2026-02-12 | 13F | Federation des caisses Desjardins du Quebec | 0 | -100,00 | 0 | |||||
| 2026-02-12 | 13F | Brown Brothers Harriman & Co | 205 | 11 | ||||||
| 2026-02-17 | 13F | Millennium Management Llc | 36.914 | 4,76 | 1.964 | 13,26 | ||||
| 2026-01-28 | 13F | DekaBank Deutsche Girozentrale | 36.017 | 0,00 | 3 | 200,00 | ||||
| 2026-02-17 | 13F | Susquehanna International Group, Llp | Call | 21.600 | 27,81 | 1.149 | 38,27 | |||
| 2026-02-10 | 13F | Bruce G. Allen Investments, LLC | 571 | 0,00 | 30 | 7,14 | ||||
| 2026-01-26 | 13F | PDS Planning, Inc | 6.430 | 4,60 | 342 | 13,25 | ||||
| 2026-02-17 | 13F | Jones Financial Companies Lllp | 54 | 0,00 | 3 | 0,00 | ||||
| 2025-11-13 | 13F/A | Peak6 Llc | Put | 0 | -100,00 | 0 | -100,00 | |||
| 2026-02-13 | 13F | Recurrent Investment Advisors LLC | 24.960 | 0,04 | 1.328 | 8,23 | ||||
| 2026-02-17 | 13F | XTX Topco Ltd | 8.923 | 475 | ||||||
| 2026-04-17 | 13F | Western Pacific Wealth Management, LP | 21 | 0,00 | 1 | 0,00 | ||||
| 2026-02-12 | 13F | Advisors Asset Management, Inc. | 8.558 | -20,62 | 455 | -14,15 | ||||
| 2026-02-04 | 13F | Ameritas Advisory Services, LLC | 0 | -100,00 | 0 | |||||
| 2025-11-13 | 13F | Deutsche Bank Ag\ | 0 | -100,00 | 0 | |||||
| 2026-02-17 | 13F | D. E. Shaw & Co., Inc. | 13.216 | 703 | ||||||
| 2026-01-22 | 13F | Bfsg, Llc | 20 | 0,00 | 1 | |||||
| 2026-02-13 | 13F | Cohen & Steers, Inc. | 605 | -28,74 | 0 | |||||
| 2026-02-11 | 13F | Rise Advisors, LLC | 0 | -100,00 | 0 | |||||
| 2026-04-06 | 13F | Versant Capital Management, Inc | 69 | 4 | ||||||
| 2026-01-15 | 13F | Frank, Rimerman Advisors LLC | 22.300 | 156,91 | 1.187 | 177,75 | ||||
| 2026-02-13 | 13F | Morgan Stanley | 888.572 | 10,84 | 47.281 | 19,85 | ||||
| 2026-02-19 | 13F | Atomi Financial Group, Inc. | 8.247 | 15,39 | 439 | 24,79 | ||||
| 2026-02-06 | 13F | Global Retirement Partners, LLC | 434 | -89,99 | 23 | -89,20 | ||||
| 2026-01-27 | 13F | Evergreen Capital Management Llc | 7.338 | 11,76 | 390 | 20,74 | ||||
| 2026-02-17 | 13F | Point72 Asset Management, L.P. | 68.536 | 562,82 | 3.647 | 617,72 | ||||
| 2026-02-17 | 13F | Northern Trust Corp | 310.161 | -17,25 | 16.504 | -10,53 | ||||
| 2026-01-22 | 13F | Venturi Wealth Management, LLC | 6.128 | 326 | ||||||
| 2026-02-04 | 13F | Paradigm Asset Management Co Llc | 400 | 0,00 | 21 | 10,53 | ||||
| 2025-11-12 | 13F | NewSquare Capital LLC | 0 | -100,00 | 0 | |||||
| 2026-04-13 | 13F | Trust Co | 12 | 0,00 | 1 | |||||
| 2026-02-17 | 13F | Public Employees Retirement System Of Ohio | 26.679 | 4,94 | 1.420 | 13,43 | ||||
| 2026-02-11 | 13F | Clearbridge Investments, LLC | 16.999 | 0,00 | 905 | 8,13 | ||||
| 2026-02-06 | 13F | HighTower Advisors, LLC | 0 | -100,00 | 0 | |||||
| 2026-02-17 | 13F | Aqr Capital Management Llc | 11.523 | 58,09 | 613 | 71,23 | ||||
| 2026-04-13 | 13F | Mather Group, Llc. | 36 | 2 | ||||||
| 2026-01-15 | 13F | Founders Capital Management | 600 | 0,00 | 32 | 6,90 | ||||
| 2026-02-11 | 13F | LPL Financial LLC | 6.695 | -28,06 | 356 | -22,10 | ||||
| 2026-02-12 | 13F | BlackRock, Inc. | 1.290.040 | 27,92 | 68.643 | 38,32 | ||||
| 2026-02-13 | 13F | Atlas Capital Advisors Llc | 340 | 88,89 | 18 | 125,00 | ||||
| 2026-01-30 | 13F | North Star Investment Management Corp. | 122 | 6 | ||||||
| 2026-02-10 | 13F | CIBC World Markets Inc. | 45.434 | -0,19 | 2.418 | 7,90 | ||||
| 2026-02-17 | 13F | Citadel Advisors Llc | 0 | -100,00 | 0 | |||||
| 2026-04-17 | 13F | AdvisorNet Financial, Inc | 0 | -100,00 | 0 | |||||
| 2026-02-13 | 13F | Van Eck Associates Corp | 147.036 | 45,61 | 8 | 75,00 | ||||
| 2026-02-17 | 13F | Bank Of America Corp /de/ | 55.605 | 183,09 | 2.959 | 206,21 | ||||
| 2026-01-23 | 13F | Assetmark, Inc | 153 | 61,05 | 8 | 100,00 | ||||
| 2026-04-13 | 13F | True Wealth Design, LLC | 249 | 31,05 | 15 | 40,00 | ||||
| 2026-04-16 | 13F | SG Americas Securities, LLC | 1.812 | 0 | ||||||
| 2026-02-10 | 13F | Goldman Sachs Group Inc | 126.702 | -22,41 | 6.742 | -16,11 | ||||
| 2026-02-12 | 13F | Wealthspire Advisors, LLC | 0 | -100,00 | 0 | |||||
| 2026-02-12 | 13F | Xponance, Inc. | 4.433 | 4,26 | 236 | 12,44 | ||||
| 2026-03-12 | 13F/A | Peak6 Llc | Call | 9.300 | 495 | |||||
| 2026-01-15 | 13F | Nisa Investment Advisors, Llc | 32 | 2 | ||||||
| 2026-02-17 | 13F | Creative Planning | 212.646 | 54,67 | 11.315 | 67,24 | ||||
| 2026-02-17 | 13F | Greenline Partners, LLC | 43.462 | -0,74 | 2.313 | 7,34 | ||||
| 2026-04-07 | 13F | Farther Finance Advisors, LLC | 2.178 | 26,04 | 128 | 39,56 | ||||
| 2026-04-06 | 13F | Highline Wealth Partners Llc | 131 | 19,09 | 8 | 40,00 | ||||
| 2026-02-12 | 13F | CIBC Private Wealth Group, LLC | 174 | 0,00 | 9 | 12,50 | ||||
| 2026-02-11 | 13F | Ramirez Asset Management, Inc. | 59.024 | 3.141 | ||||||
| 2026-02-05 | 13F | Bessemer Group Inc | 0 | 0 | ||||||
| 2026-02-17 | 13F | SageView Advisory Group, LLC | 28 | 1 | ||||||
| 2026-02-13 | 13F | Pathstone Holdings, LLC | 9.112 | 8,63 | 485 | 17,48 | ||||
| 2026-04-17 | 13F | Bell Investment Advisors, Inc | 304 | 23,08 | 18 | 30,77 | ||||
| 2025-11-12 | 13F | Crossmark Global Holdings, Inc. | 0 | -100,00 | 0 | |||||
| 2026-02-06 | 13F | EverSource Wealth Advisors, LLC | 1.562 | 49,19 | 83 | 62,75 | ||||
| 2026-02-17 | 13F | Laird Norton Trust Company, Llc | 30.973 | 1.648 | ||||||
| 2026-02-17 | 13F | Susquehanna International Group, Llp | Put | 0 | -100,00 | 0 | ||||
| 2026-01-29 | 13F | Calamos Advisors LLC | Call | 0 | -100,00 | 0 | ||||
| 2025-11-12 | 13F | Corient IA LLC | 0 | -100,00 | 0 | |||||
| 2026-01-21 | 13F | DMG Group, LLC | 10.410 | 3,24 | 554 | 11,49 | ||||
| 2026-02-13 | 13F | Mariner, LLC | 19.351 | 33,12 | 1.031 | 44,20 | ||||
| 2026-02-03 | 13F | Sequoia Financial Advisors, LLC | 23.757 | 19,46 | 1.264 | 29,24 | ||||
| 2026-02-11 | 13F | Cerity Partners LLC | 22.707 | 10,47 | 1.208 | 19,49 | ||||
| 2025-11-12 | 13F | Victory Capital Management Inc | 0 | -100,00 | 0 | |||||
| 2026-02-17 | 13F | Aquatic Capital Management LLC | 7.876 | -44,75 | 419 | -40,23 | ||||
| 2026-02-05 | 13F | Allworth Financial LP | 1.107 | 62,32 | 59 | 75,76 | ||||
| 2026-02-06 | 13F | Profund Advisors Llc | 7.091 | -6,24 | 377 | 1,34 | ||||
| 2026-01-29 | 13F | UMA Financial Services, Inc. | 118 | 3,51 | 6 | 20,00 | ||||
| 2026-02-13 | 13F | Arrowstreet Capital, Limited Partnership | 175.046 | -2,68 | 9.314 | 5,23 | ||||
| 2026-02-11 | 13F | Empowered Funds, LLC | 173.336 | 9.223 | ||||||
| 2026-02-13 | 13F | American Century Companies Inc | 621.560 | 13,07 | 33.073 | 22,27 | ||||
| 2026-01-29 | 13F | UBS Group AG | 199.914 | 135,62 | 10.637 | 154,78 | ||||
| 2026-02-12 | 13F | BRYN MAWR TRUST Co | 0 | -100,00 | 0 | -100,00 | ||||
| 2026-04-06 | 13F | GAMMA Investing LLC | 6.627 | 38,73 | 388 | 52,36 | ||||
| 2026-01-23 | 13F | Bridgewater Advisors Inc. | 5.669 | 16,36 | 341 | 32,68 | ||||
| 2026-04-07 | 13F | Signaturefd, Llc | 26.353 | 28,55 | 1.541 | 41,38 | ||||
| 2025-10-28 | 13F | Qrg Capital Management, Inc. | 0 | -100,00 | 0 | |||||
| 2026-02-09 | 13F | Hantz Financial Services, Inc. | 3.230 | 43,75 | 0 | |||||
| 2026-02-13 | 13F | SRS Capital Advisors, Inc. | 2.419 | 235,51 | 129 | 265,71 | ||||
| 2025-10-27 | 13F | First Horizon Corp | 0 | -100,00 | 0 | |||||
| 2026-03-26 | 13F | Leonteq Securities AG | 0 | -100,00 | 0 | |||||
| 2026-02-11 | 13F | Syon Capital Llc | 5.160 | 275 | ||||||
| 2026-02-12 | 13F | Quadrant Capital Group Llc | 67.725 | 3,77 | 3.604 | 12,21 | ||||
| 2026-02-17 | 13F | Russell Investments Group, Ltd. | 21 | 0,00 | 1 | 0,00 | ||||
| 2026-02-18 | 13F | Vident Advisory, LLC | 71.001 | -4,34 | 3.778 | 3,45 | ||||
| 2026-02-17 | 13F | Quadrature Capital Ltd | 16.494 | 878 | ||||||
| 2026-02-12 | 13F | Rossby Financial, LCC | 11 | 1 | ||||||
| 2025-11-14 | 13F | National Bank Of Canada /fi/ | 0 | -100,00 | 0 | |||||
| 2026-02-17 | 13F | CWM Advisors, LLC | 1.606 | 85 | ||||||
| 2026-04-15 | 13F | Generali Investments CEE, investicni spolecnost, a.s. | 5.500 | 0,00 | 322 | 9,93 | ||||
| 2026-02-11 | 13F | West Family Investments, Inc. | 9.156 | -8,11 | 487 | -0,61 | ||||
| 2026-02-13 | 13F | Neuberger Berman Group LLC | 9.494 | 1,28 | 505 | 9,54 | ||||
| 2026-02-13 | 13F | Stifel Financial Corp | 65.904 | 10,76 | 3.507 | 19,74 | ||||
| 2026-02-13 | 13F | Parkside Financial Bank & Trust | 195 | 32,65 | 10 | 42,86 | ||||
| 2026-02-11 | 13F | Group One Trading, L.p. | 53 | 3 | ||||||
| 2026-04-10 | 13F | Abound Wealth Management | 11 | -45,00 | 1 | -100,00 | ||||
| 2026-02-13 | 13F | Pinnacle Wealth Planning Services, Inc. | 2.109 | 112 | ||||||
| 2026-02-17 | 13F | Royal Bank Of Canada | 5.301 | 1.690,88 | 282 | 1.780,00 | ||||
| 2026-02-17 | 13F | Balyasny Asset Management Llc | 0 | -100,00 | 0 | |||||
| 2025-11-21 | 13F | Ovata Capital Management Ltd | 0 | -100,00 | 0 | -100,00 | ||||
| 2025-10-30 | 13F | Twin Peaks Wealth Advisors, LLC | 0 | -100,00 | 0 | |||||
| 2026-02-12 | 13F | Skopos Labs, Inc. | 5.636 | 5,33 | 306 | 16,35 | ||||
| 2026-02-13 | 13F | Citigroup Inc | 9.859 | -72,24 | 525 | -70,01 | ||||
| 2026-02-12 | 13F | Nuveen, LLC | 14.140 | -9,19 | 752 | -1,83 | ||||
| 2026-01-28 | 13F | CAPROCK Group, Inc. | 8.479 | 16,86 | 451 | 19,63 | ||||
| 2026-02-13 | 13F | PCM Encore, LLC | 11.121 | 592 | ||||||
| 2026-02-17 | 13F | Grantham, Mayo, Van Otterloo & Co. LLC | 52.393 | -19,74 | 2.788 | -13,23 | ||||
| 2026-02-10 | 13F | Bnp Paribas Arbitrage, Sa | 250.895 | -1,21 | 13.350 | 6,82 | ||||
| 2026-02-06 | 13F | Larson Financial Group LLC | 26 | 420,00 | 1 | |||||
| 2026-02-17 | 13F | Advisor Group Holdings, Inc. | 497 | 41,19 | 26 | 52,94 | ||||
| 2026-02-05 | 13F | LGT Group Foundation | 4.865 | 0,00 | 260 | 7,02 | ||||
| 2026-04-02 | 13F | Ares Financial Consulting, LLC | 11 | 0,00 | 1 | |||||
| 2026-02-12 | 13F | Bank Of Montreal /can/ | 36.918 | -0,69 | 1.964 | 7,38 | ||||
| 2026-02-19 | 13F | CI Private Wealth, LLC | 30.097 | 16,96 | 1.575 | 24,41 | ||||
| 2026-02-17 | 13F | Citadel Advisors Llc | Put | 5.900 | 314 | |||||
| 2026-02-06 | 13F | Pnc Financial Services Group, Inc. | 18.850 | 15,94 | 1.003 | 25,38 | ||||
| 2026-02-17 | 13F | Quantinno Capital Management LP | 109.752 | 50,25 | 5.840 | 62,47 | ||||
| 2026-02-09 | 13F | Key FInancial Inc | 89 | 0,00 | 5 | 0,00 | ||||
| 2026-02-10 | 13F | Connor, Clark & Lunn Investment Management Ltd. | 217.367 | 24,72 | 11.566 | 34,86 | ||||
| 2026-02-10 | 13F | Root Financial Partners, LLC | 38 | 2 | ||||||
| 2025-11-14 | 13F | Wetherby Asset Management Inc | 14.312 | -2,23 | 704 | -0,71 | ||||
| 2026-02-12 | 13F | Jane Street Group, Llc | 5.664 | -73,39 | 301 | -71,25 | ||||
| 2026-02-12 | 13F | Jane Street Group, Llc | Call | 0 | -100,00 | 0 | -100,00 | |||
| 2026-02-12 | 13F | Jane Street Group, Llc | Put | 5.900 | 314 | |||||
| 2026-02-13 | 13F | MAI Capital Management | 84 | -62,50 | 4 | -63,64 | ||||
| 2025-11-19 | 13F | Caitong International Asset Management Co., Ltd | 0 | -100,00 | 0 | |||||
| 2026-02-13 | 13F | Schroder Investment Management Group | 9.600 | -43,69 | 513 | -39,12 | ||||
| 2026-02-13 | 13F | Smartleaf Asset Management LLC | 21 | 110,00 | 1 | |||||
| 2026-04-08 | 13F | Miracle Mile Advisors, LLC | 3.580 | 209 | ||||||
| 2026-02-11 | 13F | Simplex Trading, Llc | 0 | -100,00 | 0 | |||||
| 2026-01-28 | 13F | Oversea-Chinese Banking CORP Ltd | 47.310 | 92,16 | 2.517 | 107,84 | ||||
| 2026-02-13 | 13F | Barclays Plc | 2.302 | 109,08 | 122 | 125,93 | ||||
| 2026-02-17 | 13F | Tower Research Capital LLC (TRC) | 5.530 | 58,05 | 294 | 70,93 | ||||
| 2026-01-08 | 13F | Tuttle Tactical Management LLC | 8.931 | 475 | ||||||
| 2025-11-04 | 13F | High Note Wealth, LLC | 0 | -100,00 | 0 | |||||
| 2026-02-17 | 13F | Voleon Capital Management Lp | 9.119 | 485 | ||||||
| 2025-11-12 | 13F | Headlands Technologies LLC | 0 | -100,00 | 0 | |||||
| 2026-04-20 | 13F | Ronald Blue Trust, Inc. | 11.230 | -34,49 | 657 | -28,07 | ||||
| 2025-11-07 | 13F | Sierra Ocean, Llc | 0 | -100,00 | 0 | |||||
| 2026-02-13 | 13F | State Street Corp | 850.425 | 5,11 | 45.251 | 13,66 | ||||
| 2026-02-17 | 13F | Fmr Llc | 46.144 | 1,26 | 2.455 | 9,50 | ||||
| 2026-02-17 | 13F | Parvin Asset Management, LLC | 0 | -100,00 | 0 | |||||
| 2026-02-13 | 13F | Marshall Wace, Llp | 0 | -100,00 | 0 | -100,00 | ||||
| 2026-02-11 | 13F | Jpmorgan Chase & Co | 2.152 | 2,14 | 115 | 10,68 | ||||
| 2026-04-13 | 13F | IFP Advisors, Inc | 60 | 25,00 | 4 | 50,00 | ||||
| 2026-01-29 | 13F | Vanguard Group Inc | 285.158 | 0,00 | 15.173 | 8,13 | ||||
| 2026-02-03 | 13F | Ballentine Partners, LLC | 10.739 | 31,12 | 571 | 41,69 | ||||
| 2025-11-13 | 13F/A | Peak6 Llc | 0 | -100,00 | 0 | -100,00 | ||||
| 2026-02-13 | 13F | Ubs Asset Management Americas Inc | 461 | 25 | ||||||
| 2026-02-03 | 13F | SBI Securities Co., Ltd. | 131 | 1,55 | 7 | 0,00 | ||||
| 2026-02-17 | 13F | Guggenheim Capital Llc | 9.370 | 36,01 | 499 | 46,90 | ||||
| 2026-02-12 | 13F | Principal Securities, Inc. | 0 | -100,00 | 0 | -100,00 | ||||
| 2026-02-02 | 13F | Fifth Third Bancorp | 25 | 0,00 | 1 | 0,00 | ||||
| 2026-02-10 | 13F/A | Northwestern Mutual Wealth Management Co | 258 | 32,99 | 14 | 44,44 | ||||
| 2026-01-21 | 13F | Yousif Capital Management, Llc | 28.683 | 0,00 | 1.723 | 22,04 | ||||
| 2026-04-20 | 13F | Ritholtz Wealth Management | 4.083 | 0,15 | 239 | 10,19 | ||||
| 2026-02-13 | 13F | Wells Fargo & Company/mn | 4.354 | -0,34 | 232 | 7,44 | ||||
| 2026-02-13 | 13F | Glen Eagle Advisors, LLC | 30 | 0,00 | 2 | 0,00 | ||||
| 2026-02-12 | 13F | Dimensional Fund Advisors Lp | 980.307 | -4,19 | 52.162 | 3,60 | ||||
| 2026-02-18 | 13F | Mackenzie Financial Corp | 0 | -100,00 | 0 | |||||
| 2026-01-22 | 13F | Financial Consulate, Inc | 16 | 1 | ||||||
| 2026-01-27 | 13F | WealthCollab, LLC | 30 | 0,00 | 2 | 0,00 | ||||
| 2025-11-14 | 13F | Raymond James Financial Inc | 0 | -100,00 | 0 | |||||
| 2026-02-11 | 13F | O'shaughnessy Asset Management, Llc | 35.374 | 4,38 | 1.882 | 12,90 | ||||
| 2026-02-03 | 13F | Ethic Inc. | 4.697 | 250 | ||||||
| 2026-02-13 | 13F | First Trust Advisors Lp | 7.230 | 59,11 | 385 | 72,20 | ||||
| 2026-02-13 | 13F | Centiva Capital, LP | 0 | -100,00 | 0 | |||||
| 2026-02-05 | 13F | Elyxium Wealth, LLC | 42 | 2 | ||||||
| 2026-02-13 | 13F | JustInvest LLC | 52.217 | 44,50 | 2.778 | 56,24 | ||||
| 2026-02-23 | 13F | Virtu Financial LLC | 0 | -100,00 | 0 | |||||
| 2026-01-22 | 13F | Bear Mountain Capital, Inc. | 0 | -100,00 | 0 | |||||
| 2026-02-13 | 13F | NLB Skladi, upravljanje premozenja, d.o.o. | 87.388 | 4.650 | ||||||
| 2026-02-13 | 13F | Ieq Capital, Llc | 21.090 | 32,57 | 1.122 | 43,48 | ||||
| 2026-02-17 | 13F | Advisory Services Network, LLC | 0 | -100,00 | 0 | |||||
| 2026-02-11 | 13F | Vise Technologies, Inc. | 14.874 | -2,25 | 791 | 5,75 | ||||
| 2025-11-06 | 13F | Johnson Investment Counsel Inc | 0 | -100,00 | 0 | |||||
| 2026-02-17 | 13F | Engineers Gate Manager LP | 18.850 | 52,55 | 1.003 | 64,97 |